
Ten Strands’ 2026 Annual Impact Report brings a year of environmental education work into one website. We built the microsite around the people in the report: teachers, students, school leaders, and the supporters who make the work possible.
The brief called for more than putting a document online. The report needed room for photographs, video, longer stories, financial information, and acknowledgments, while still being easy to browse. Someone looking for the financials should be able to go straight there. Someone interested in a classroom story should be able to spend a few minutes with it.
The result is an interactive nonprofit annual report with its own address, visual identity, and reading experience. It also reflects what we enjoyed about this project: an easygoing collaboration with a client who brought thoughtful content and specific feedback to the process.
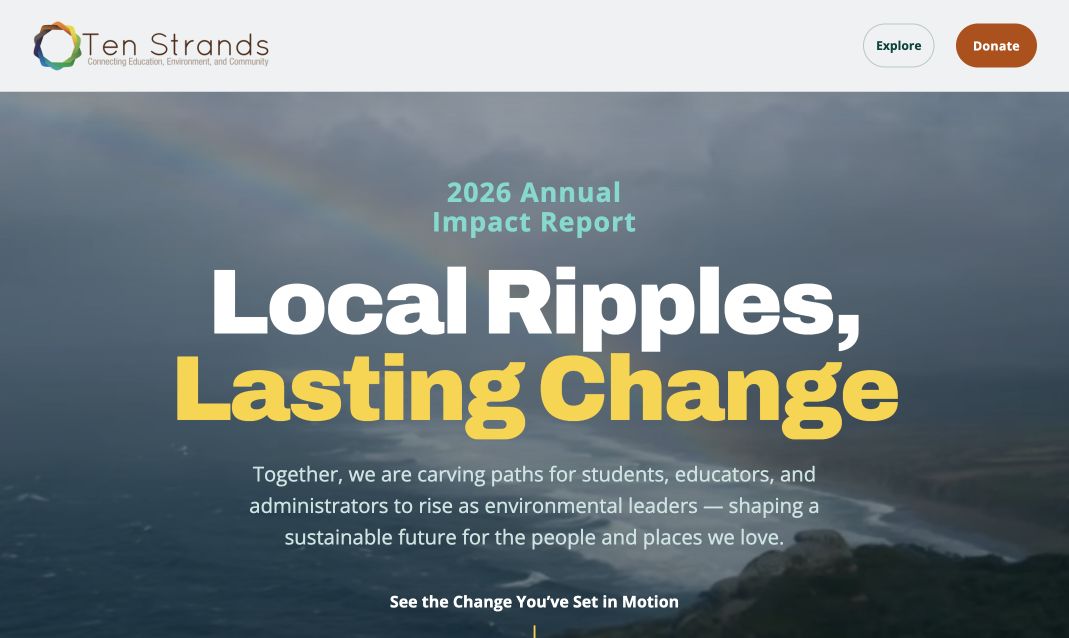
A visual theme that belongs to the report
The report’s theme, “Local Ripples, Lasting Change,” gave us a useful starting point. Water, movement, and connections between local actions carry through the design. The opening video combines landscapes and people, and a river-like line continues down the page to connect its sections.
We used Ten Strands’ colors, large headings, photographs, and varied section layouts to give the report its own character. The design can move from a personal story to a financial summary without making both look like the same card.
There is also a practical limit to motion. The opening video has a pause control, and the report includes a reduced-motion treatment. Movement should support the report without making someone sit through an animation to reach it.
Short introductions with room for the full story
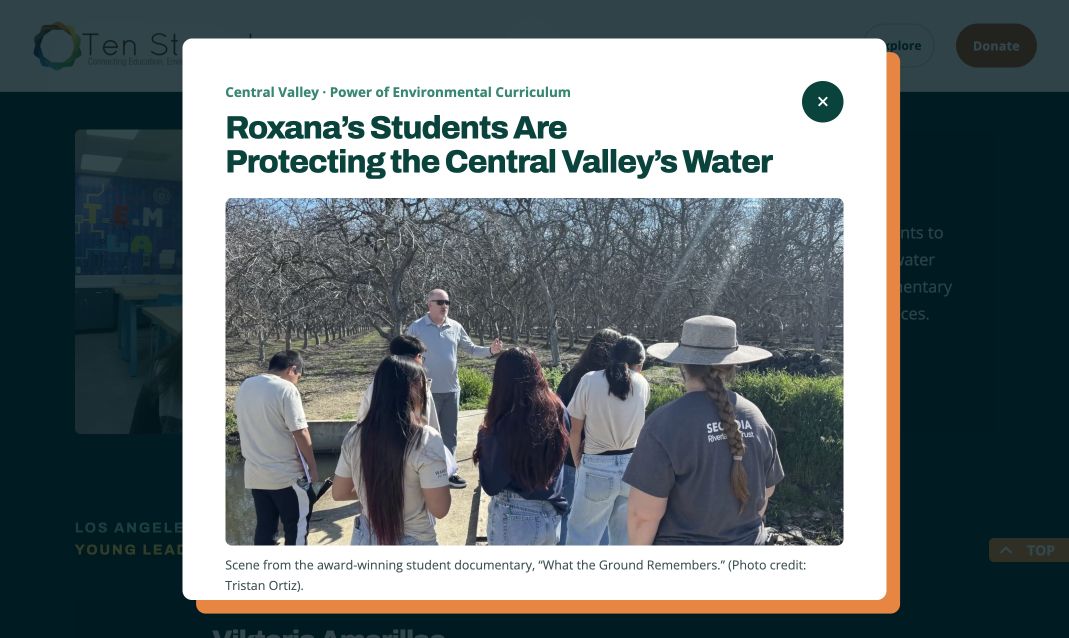
The impact section introduces each person with a photograph, location, and a short account of their work. Readers can open a story for the longer version, then return to the report.
Roxana Flores’s story is a good example. The main page introduces a teacher and her students’ groundwater project. The expanded story adds photographs, context, quotations, and an embedded student documentary, with a separate YouTube link. That is much more useful than squeezing everything into a small block of text on the main page.
We used the same approach for leadership messages and supporter testimonials: show enough to help someone decide what to read, then make the rest available on request. The dialogs include close controls and keyboard handling. On smaller screens, the content reflows so the longer stories remain readable.
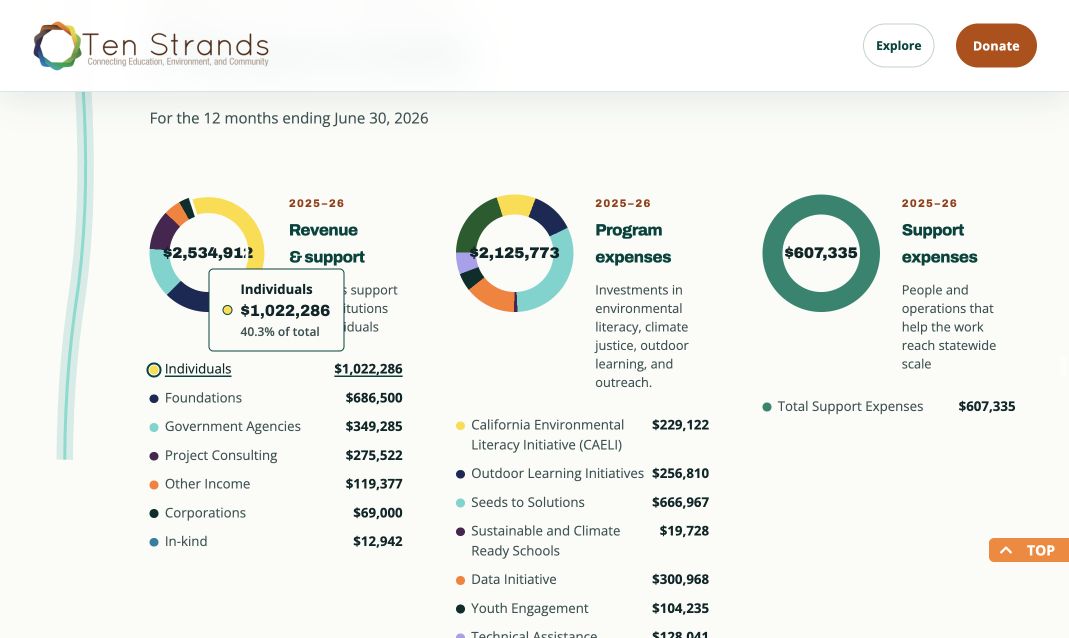
Financials readers can explore
The financial section separates revenue and support, program expenses, and support expenses. Each chart shows its total alongside a written category breakdown.
Selecting a category reveals its amount and share of the total. Readers can use the labels as well as the chart, so they do not have to identify a small colored segment to find a figure. The reporting period and the note about the change in accounting basis sit with the financial information.
These are small design decisions, but they matter in an annual report. A chart should help someone understand the numbers, not make them work harder to find them.
The acknowledgments deserve attention, too
Annual reports contain a lot of names. We gave donors, partners, staff, and board members proper space in the page rather than treating them as an appendix.
Donors are grouped by giving level, with a key explaining recognition for long-term support, consecutive giving, and new supporters. The team section pairs names and roles with portraits and links. Partners have a dedicated section of their own.
The Explore menu lets readers jump to major sections, including leadership, impact, financials, and donor recognition. Donation links and a newsletter-signup link connect the report back to Ten Strands’ main website. The report has a distinct design, but it still belongs to the organization’s wider web presence.
Working through the details together
This was an easygoing project to work on with the Ten Strands team. They supplied content and images, reviewed the assembled site, and gave us concrete notes we could act on. We worked through shared documents and browser comments, so feedback could point to the actual section or detail being discussed.
The revisions were the kinds of things that make a report feel finished: a photograph or caption, the wording of a program credit, a link, the way a financial date appeared, or how a chart label behaved. We made those changes in the working site and checked them in context.
Seeing the report in a browser helped. The team could review the words alongside the photos and interactions, rather than having to imagine how a document would translate into a website. We could also check the same content at different screen sizes as it developed.
What another nonprofit can take from it
A microsite makes sense when an annual report has stories, media, and different routes through the content. Ten Strands’ report lets a reader move between a student’s experience, the organization’s finances, and the people supporting the work without treating every visit as a cover-to-cover read.
A PDF can still serve people who need a printable or fixed copy. The website earns its place by making the report easier to browse and giving its content room to work on different screens. It is not the right format simply because it is more interactive.
Explore Ten Strands’ 2026 report to see the finished site. If you are planning your next annual report, tell us about the project. We work with nonprofits on standalone microsites, WordPress websites, and the content review and ongoing oversight that help keep them useful after launch.
Need help with your site?
We offer WordPress development. Send us the site and what you need help with, or read more about the service.